

meta data for this page
Turtle Diagram Template
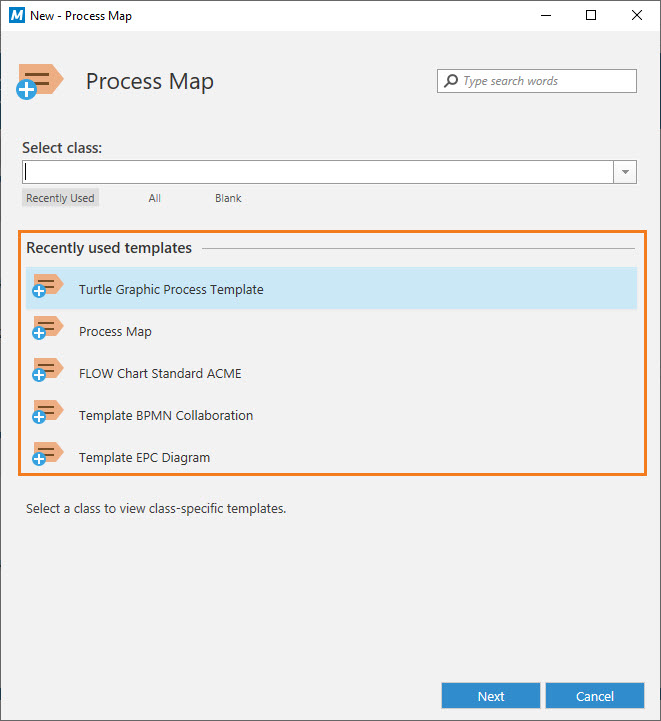
This example is about the benefits of creating and using templates in M-Files Process Maps. If there are already templates inside your vault, they will show up when you choose to create a new map.
By selecting a template, a new Process Map will be created. From there on, you can use it like any other Process Map and take advantage of the unique functions of the template.
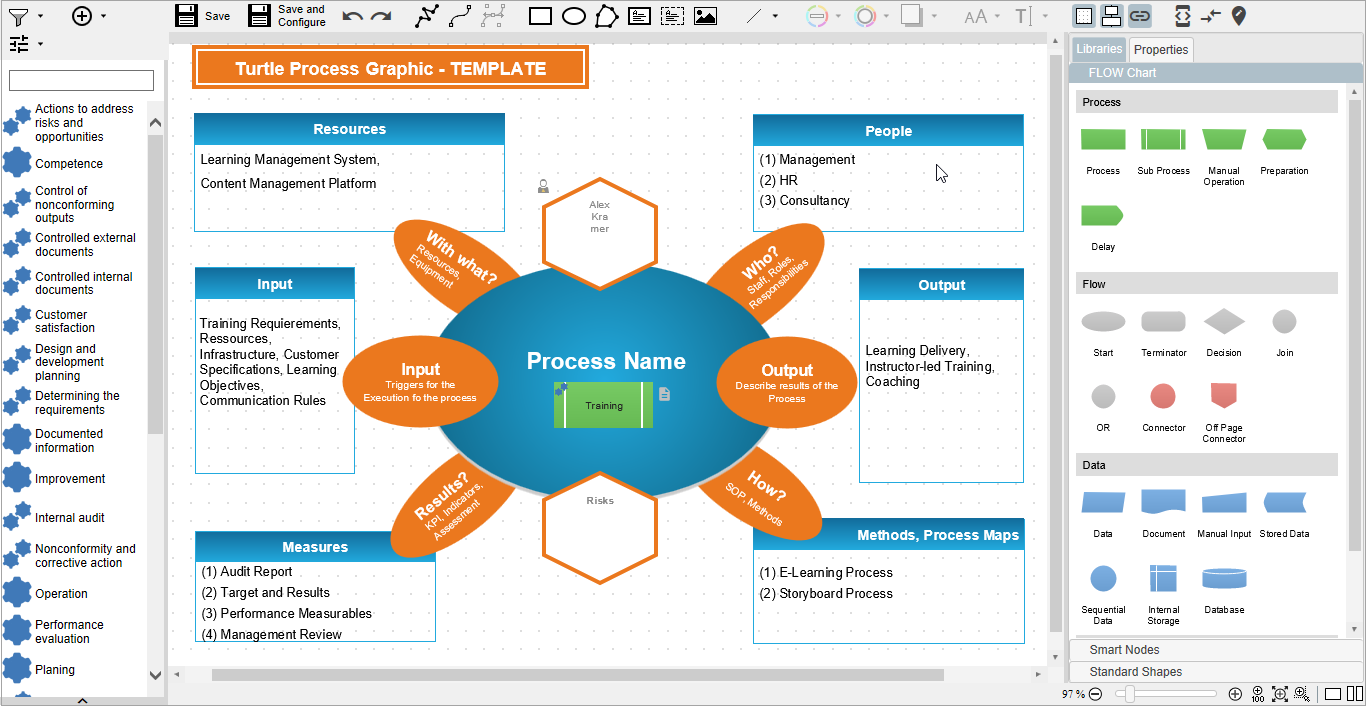
This specific template is a so-called Turtle Chart. It is used to display desired data of a process that was dropped on its “body” automatically on its “extremities”. As you can imagine, it is way faster to use it as a template than filling it out manually. By doing so, you will soon recognize how easy it is to standardize processes. Also, the time a user needs to create a map will decrease significantly when using a template. If you wish to learn more about the creation of templates, click here.