

meta data for this page
Value Chain Diagram
M-Files Process Maps allows you to visualize the value creation processes of your company graphically. That offers you the great added value that even people from outside the field can see your complex internal processes at a glance.
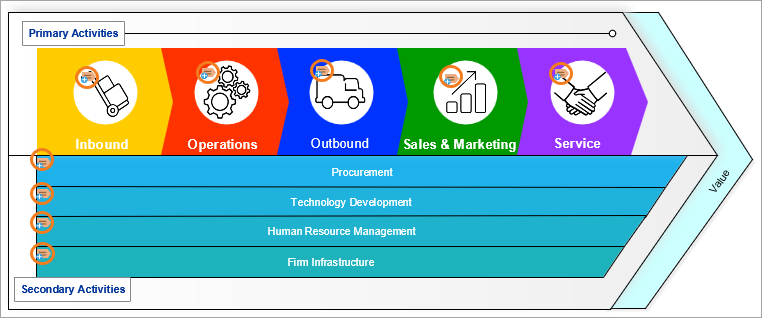
For example, this diagram describes the value-adding process of a specific company. Every Main- and support process is displayed. Every viewer can tell you right away, which methods the company uses to generate value and in which order they proceed. That is possible due to the wide variety of usable colors and easily understandable pictograms.
But M-Files Process Maps does not stop here. You may have recognized some small icons attached to each process of the Value Chain. They indicate connected M-Files objects. In that case, the company decided to link the departments which are involved in the specific work step.
With a left-click on the chosen step, the metadata card of the selected department is shown.
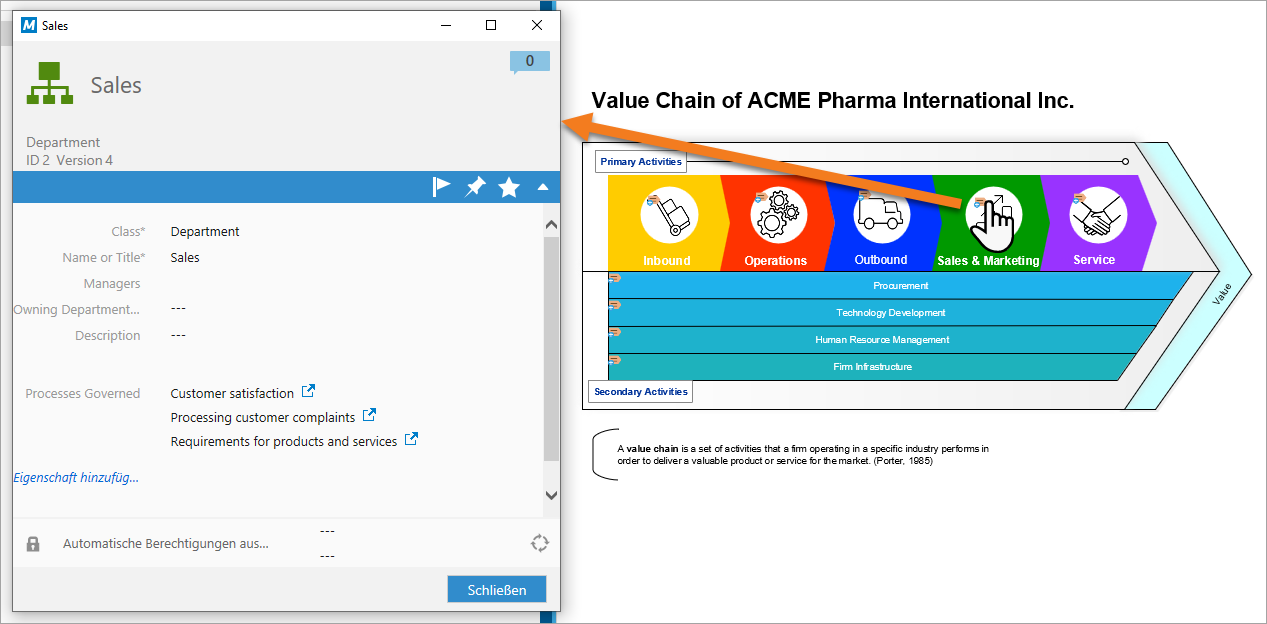
The action, which is performed when left-clicking, could be easily replaced with any other command for a different M-Files object. For example, if you want to open a Document or write an E-Mail to the responsible employee. If you have further questions on working with M-Files objects within Process Maps, just click here.