Table of Contents
Smart Nodes for Dashboarding
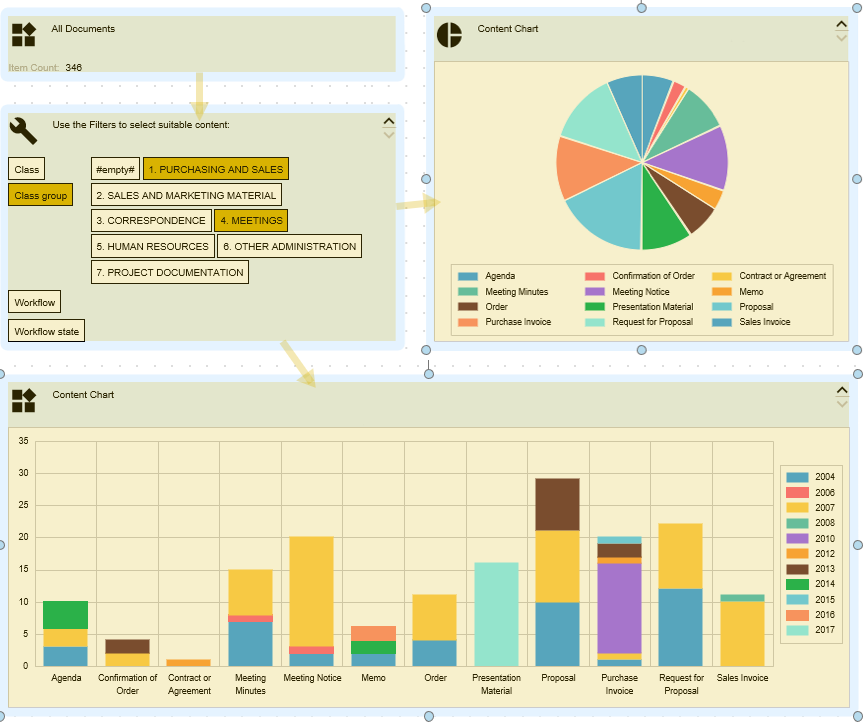
Smart Nodes for Dashboarding allow you to quickly and efficiently display the data of a single M-Files view in multiple display formats. To do this, you link an M-Files view to just a single root Smart Node, which then passes the resulting data to any number of Smart Nodes. With the combination of both Smart Nodes for Views and Smart Nodes for Charting, you get a powerful tool that gives your users deep insight into your chosen data set.
Special features of Smart Nodes for Dashboarding are:
- View a single dataset in different ways.
- Combine different Smart Nodes, which allows e.g. filtering of the processed data of a chart.
- Quick replacement of the connected M-Files View.
- Fast development of Templates.
Smart Nodes for Dashboarding are similar to Smart Nodes for Charting and Smart Nodes for Views in terms of their basic functionality and customization options. For this reason, this article will not look at individual customization options of the Smart Nodes themselves. If you are looking for information about general customization options, please see the article on Smart Nodes for Views and Smart Nodes for Charting, respectively.
Where to find Smart Nodes for Dashboarding
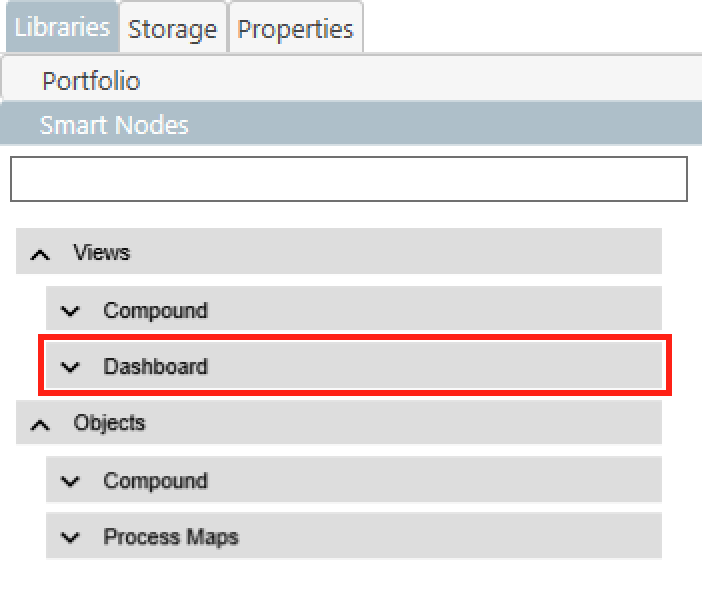
- Smart Nodes for Dashboarding can be found in the Smart Node library in the
Dashboardtab of theViewscategory. - After opening the Dashboard tab, you can access a wide range of Smart Nodes for M-Files Views and charting, that can be used for creating dashboards.
- If you want to learn more about the general use of the Smart Node Library, click here.
Types & How to Use Smart Nodes for Dashboarding
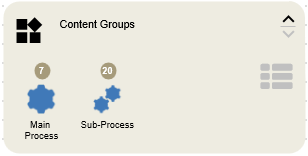
Except for a few minor differences, the Smart Node for Dashboarding Tab includes the same Smart Node types as Compound tab of the view category, but we will briefly discuss the different types that can be used to build dashboards.
Dashboard Vault-View
The Dashboard Vault View Smart Node is the starting point of any dashboard. It can also be considered as the root from which the M-Files View to be examined in a dashboard is defined. To learn how exactly to link an M-Files View to a Smart Node, click here. How to make modifications to the Smart Node itself can be read here. Please note that this Smart Node is the only one that is able to define a Result Limit for the whole Dashboard.
Dashboard Vault-View Content-Filter
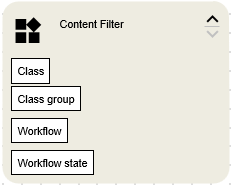
This Smart Node acts as an intermediary between the Root Smart Node and the subsequent ones in the Dashboard series. It allows you to limit the objects contained in the linked View by using a filter. For this, you can choose between different properties and the corresponding values. Do not be confused by the fact that only the properties are displayed by default. When one of the properties is selected, the corresponding values will appear. Find out more about customizations here.
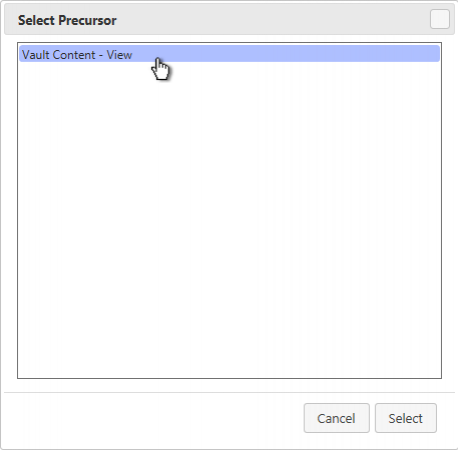
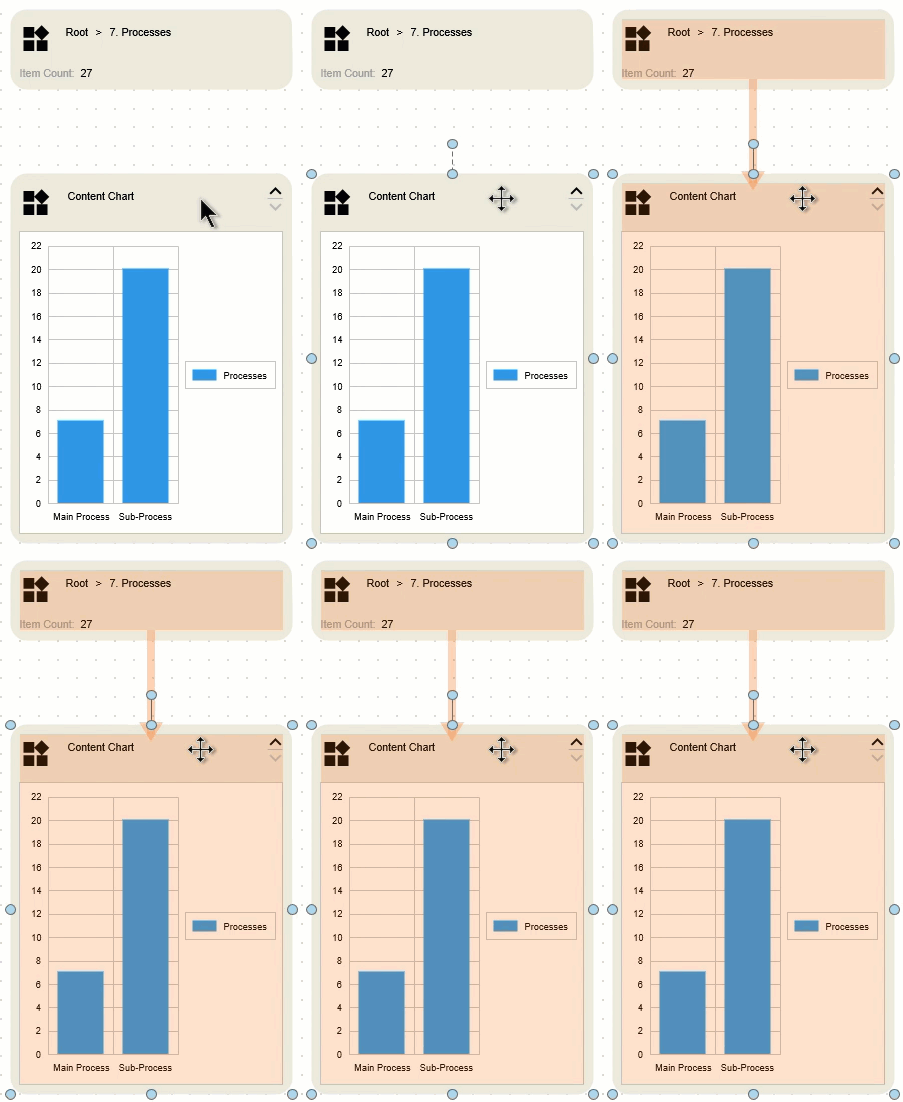
If that one or any subsequent Smart Node for Dashboarding is dragged onto the canvas, the Select Precursor dialog will appear. As mentioned earlier, Smart Nodes for Dashboarding process the dataset of a root Smart Node (Dashboard Vault-View). You need to select one of those in the Select Precursor dialog.
Dashboard Vault-View Content
This Smart Node represents the actual objects of the view associated with the dashboard. Find out exactly how it works and customization options here.
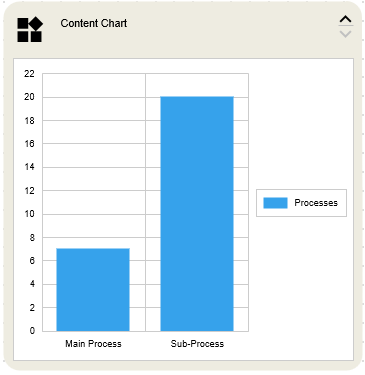
Dashboard Vault-View Content-Chart
This type of Smart Node offers the unique possibility to display the content of a view by using a diagram. This makes it possible to display the often complex architecture of views in a more comprehensible and clear way. You can read about the extensive customization options of Charting Smart Nodes here.
Interesting Features of Smart Nodes for Dashboarding
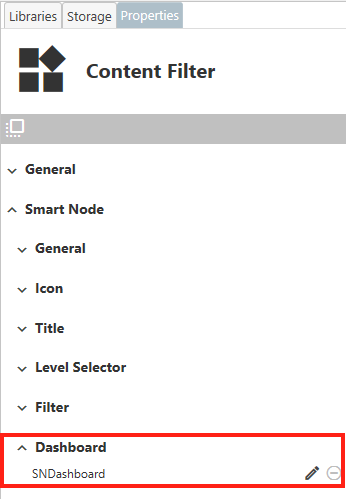
Do not worry if you have selected the wrong Smart Node as a source. You can always change the root via the Properties menu. Just select the desired Smart Node, switch to its Properties section and expand the Dashboard tab. Now you just have to select the entry SNDashboard and there you can select a new root Smart Node.
