Document Dashboard
The structure of an M-Files view and its related content can be difficult to understand, especially for new users. However, with the use of M-Files Process Maps, this is a thing of the past. Thanks to the new Smart Nodes for Charting and Smart Nodes for Views added in version 1.9, it is possible to create freely customizable dashboards that dynamically display the contents of your view.
First of all, this is a Process Map that has been assigned to a view as a Home Tab (For more information, click here). In our case, it is a view that deals with documents.
And exactly these documents are displayed in our dashboard sorted by their most important properties. This would be, for example, which document types were created and when or which employee is responsible for a document.
In this sample use case you also may have noticed that the used Smart Nodes do not look the same as usual. They look FLAT and don´t show handles for minimizing. Like any other element, the appearance of Smart Node can be customized. For more information click here.

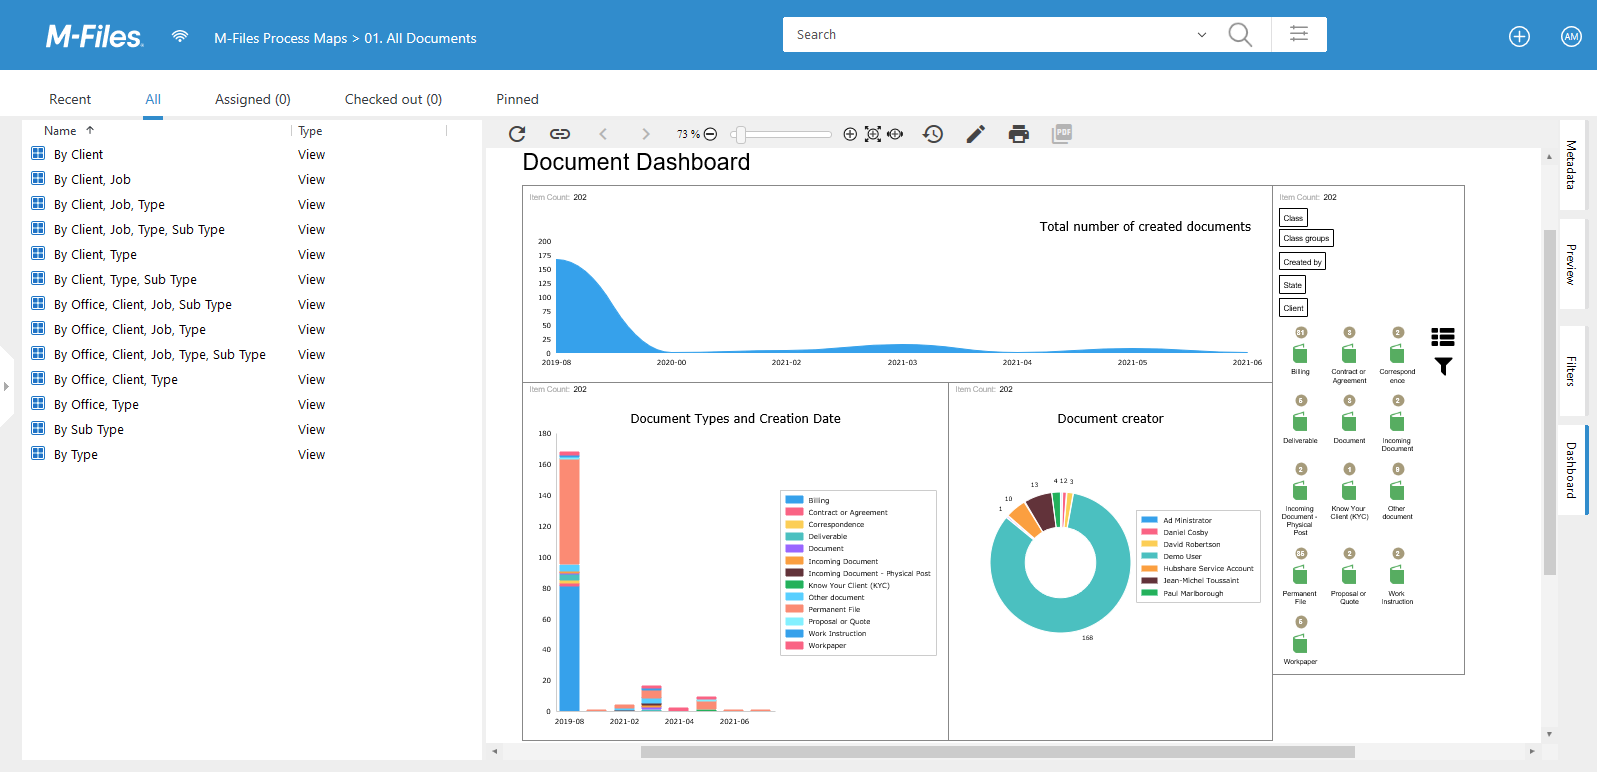
But let's have a deeper look at what we can actually see on this Dashboard. Fundamentally it is based on four different Smart Nodes:
- Area Chart - The top chart shows the viewer how many new documents have been created over the years. This way, the current trend is visible to everyone at first sight.
- Bar Chart - Similar to the previous chart, documents are also sorted by their creation dates. The difference here, however, is that a deeper insight is provided. In addition, the bars are also divided by color according to the individual document types. This way you can quickly find out which types are of particular importance for your company.
- Doughnut Chart - Here it is shown proportionally which user has created how many documents. For evaluation purposes this is particularly relevant.
- Vault-View with Filter and Content - This one can be used as a filter to quickly find exactly the document you need. By default, all documents are displayed grouped by their classes. However, this can be customized with predefined filters.
Click here for an overview of all chart types included in M-Files Process Maps.
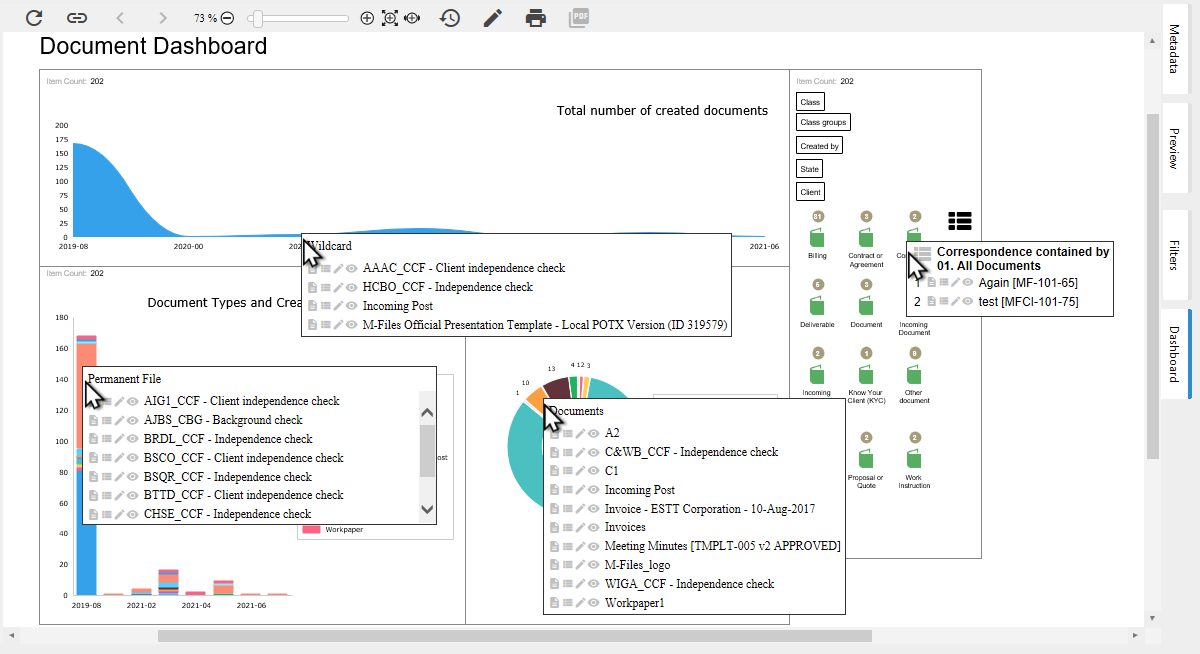
In addition to the graphical representation, this dashboard has another functional feature. When you hover your mouse over the individual sections of the charts, the related documents are displayed.
Using the individual icons in the mouse-over next to the document names, you can directly:
- Access its Metacard
- Trigger a search to view it in M-Files
- Check it out for editing
- or view it in read-only mode
Click here to see the full functionality of the mouse-over.
All of these features allow the user to navigate through this once complex view in a descriptive, efficient, and results-oriented manner.