Table of Contents
Product Idea and Components
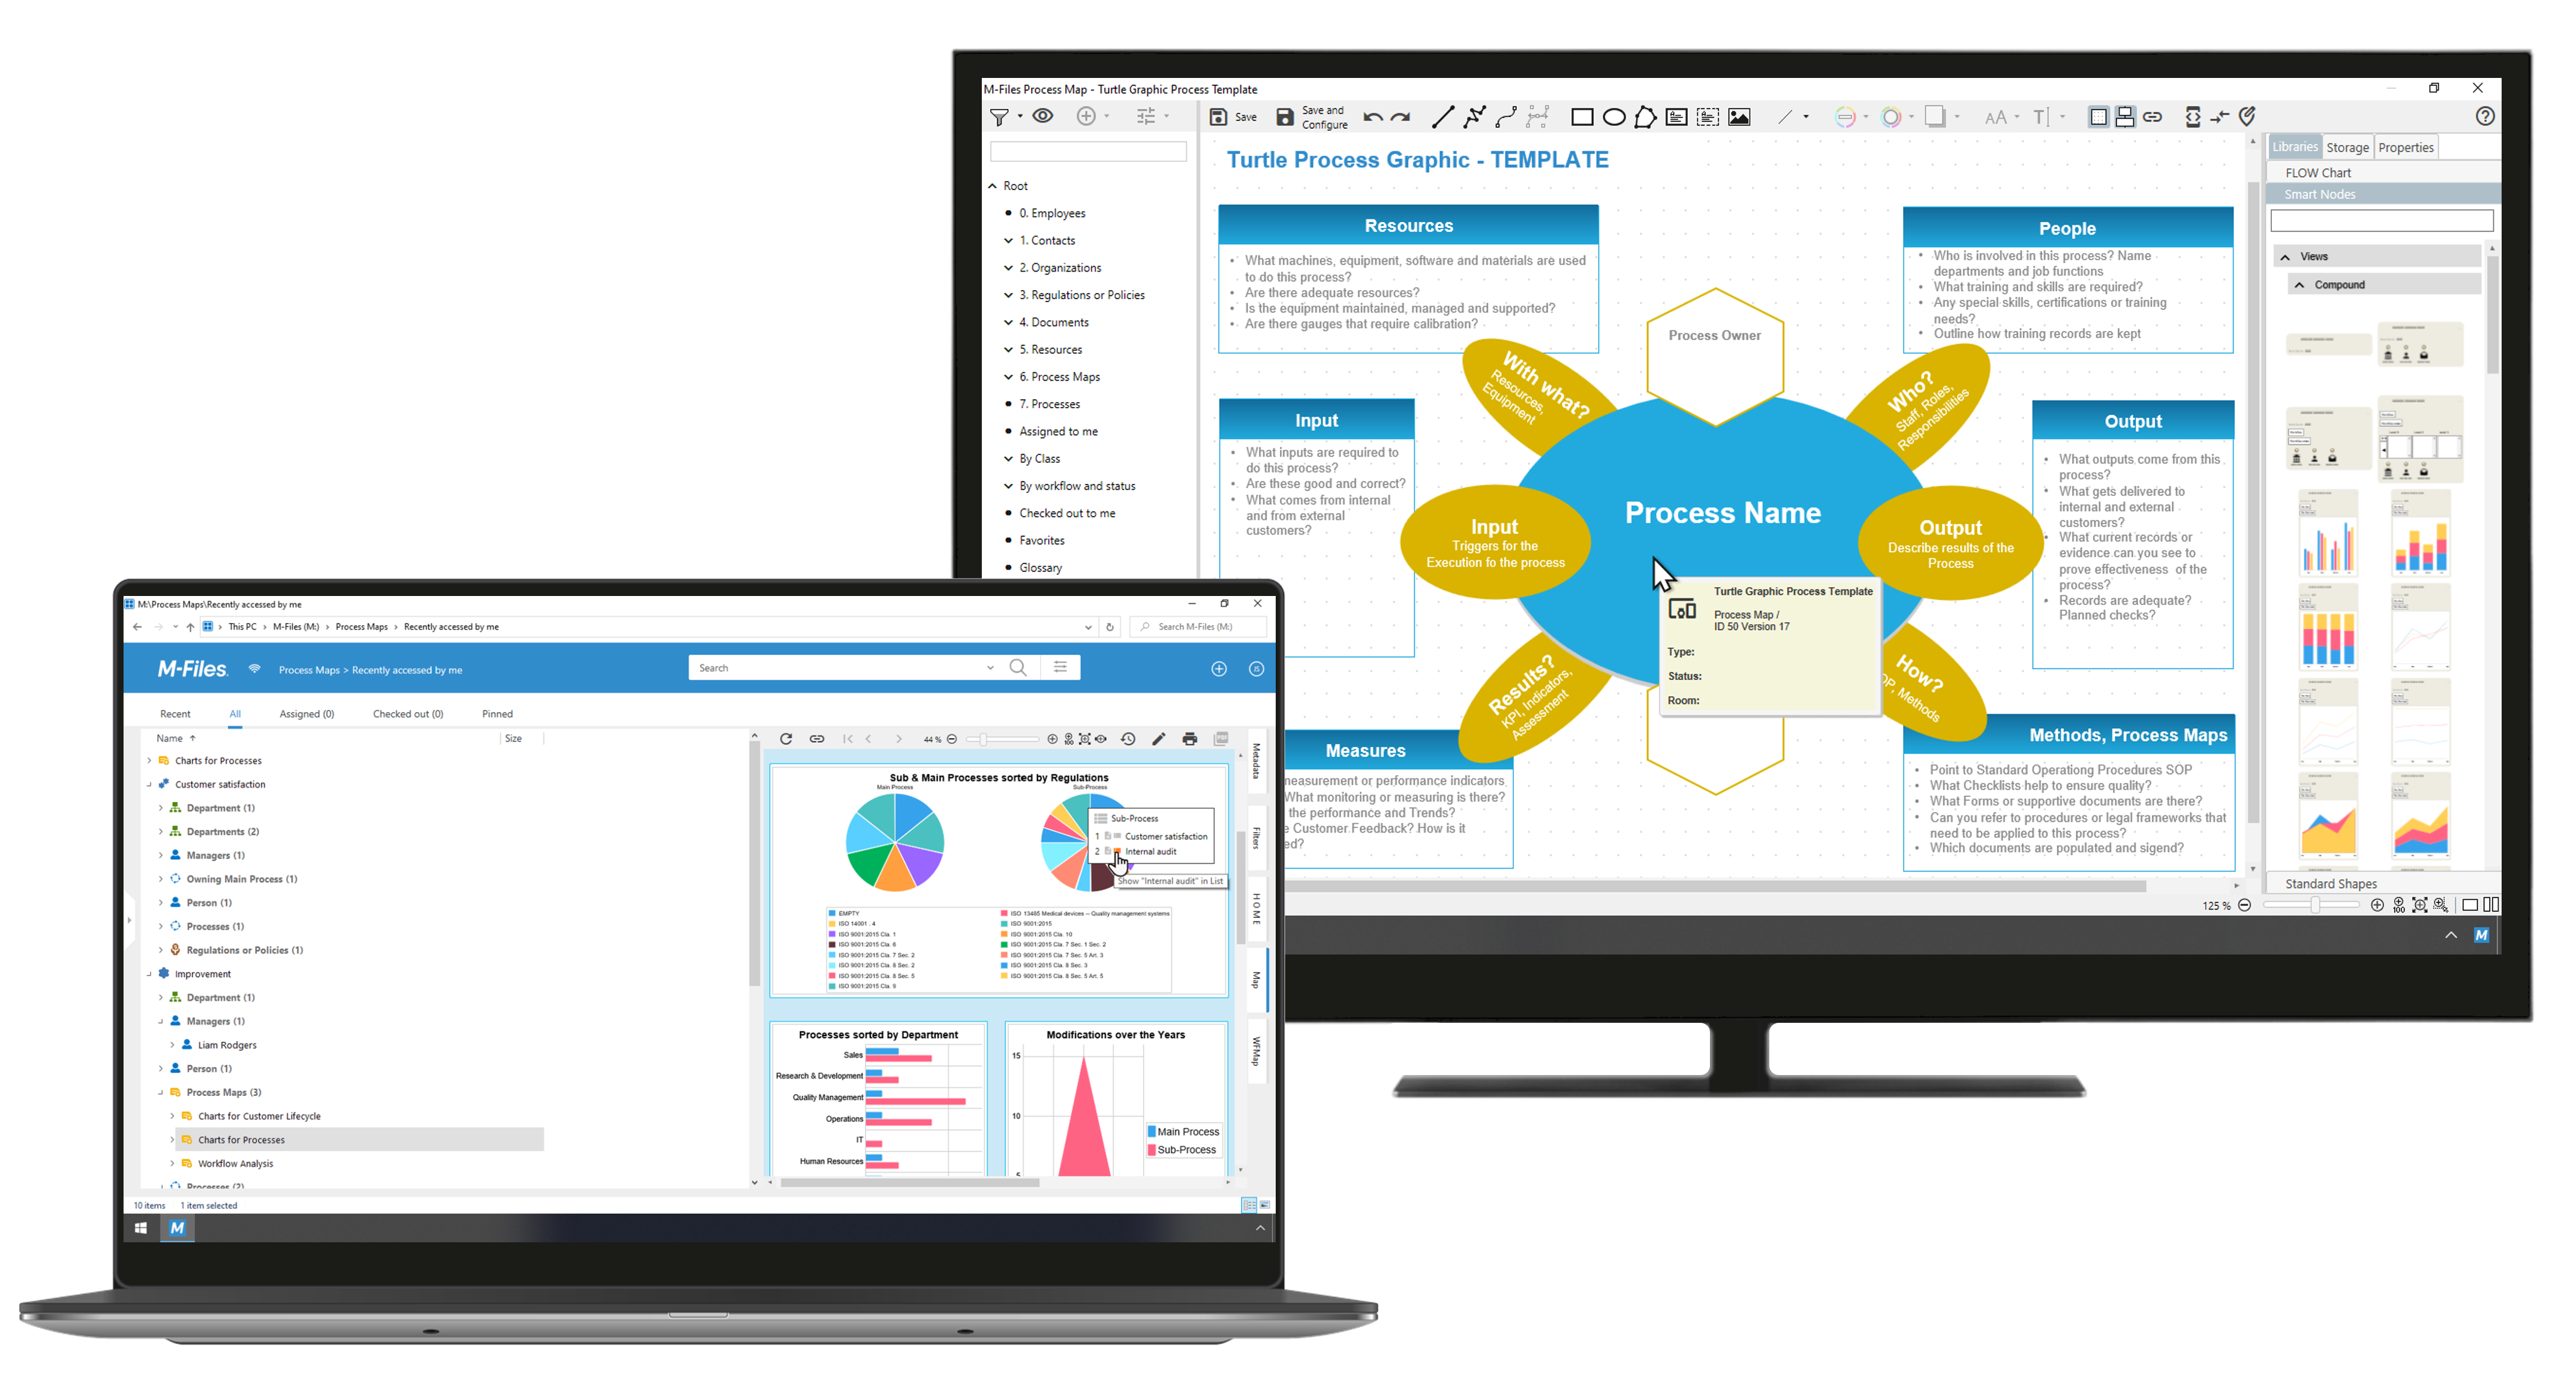
M-Files Process Maps provides information in a visual context. Graphical process maps combine and connect process flowcharts with relevant data and documents. Job aids, visual navigation and workload charts provide insight and guidance, when users need it.
- Simple process modelling via drag & drop
- Maintain and manage data, processes, maps and documents all in one place
- Direct integration with M-Files objects, views and workflows
- Assign interactive commands to M-Files objects directly within the map
- Navigate from map to map, jump to views or documents
- Show maps context sensitively, based on the selected view, object or workflow state
- Workflow maps display where documents are “on their route”
- Workload charts provide an overview on what is to be done
- Dynamic values and smart nodes make content easily understandable
- Multi-user concept with shared value storage
M-Files Process Maps adds three core functionalities to any existing M-Files vault
- Process flow diagrams for process documentation can be created with the built-in “Visio-like” designer and different process methodology toolsets (BPMN, FLOW, VCD, EPC). They can be enhanced with links to rules, documents and other M-Files content. These graphics are shown on demand in the preview pane.
- Job aids are maps that are dynamically provided along the way, guiding users to the right content, context sensitively and at the right time. Dynamic workflow maps are an example here. Dynamic values and commands provide direct access and interaction with the vault content. Also custom menues as interactive graphics guide users to the right content.
- Workload Charts show the content of M-Files views transformed into interactive bar charts, pie- or funnel diagrams where content is suitable. View Smart Nodes that group and aggregate data and documents and allow interactive access with just one click.
All three aspects greatly enhance the experience for the end user. M-Files users can visually navigate to the information stored in M-Files and they are guided to the right information in a way that is natural to the human brain. M-Files Process Maps provides an editing environment to create graphical process descriptions as flowcharts, but also hierarchical menu structures, cheat sheets, workflow maps and job aids can be created. Workload Charts and Smart Nodes transform M-Files data into meaningful, interactive graphics.
Components of the Add-on
The software consists of three basic modules:
- Context-sensitive tabs for the Map Preview
- Central configuration in M-Files Admin Client
as well as:
- The “Process Map” object type
- Classes for notations
- And the "Process Map Objects" view
which are set up automatically, when the process maps is being installed.