

meta data for this page
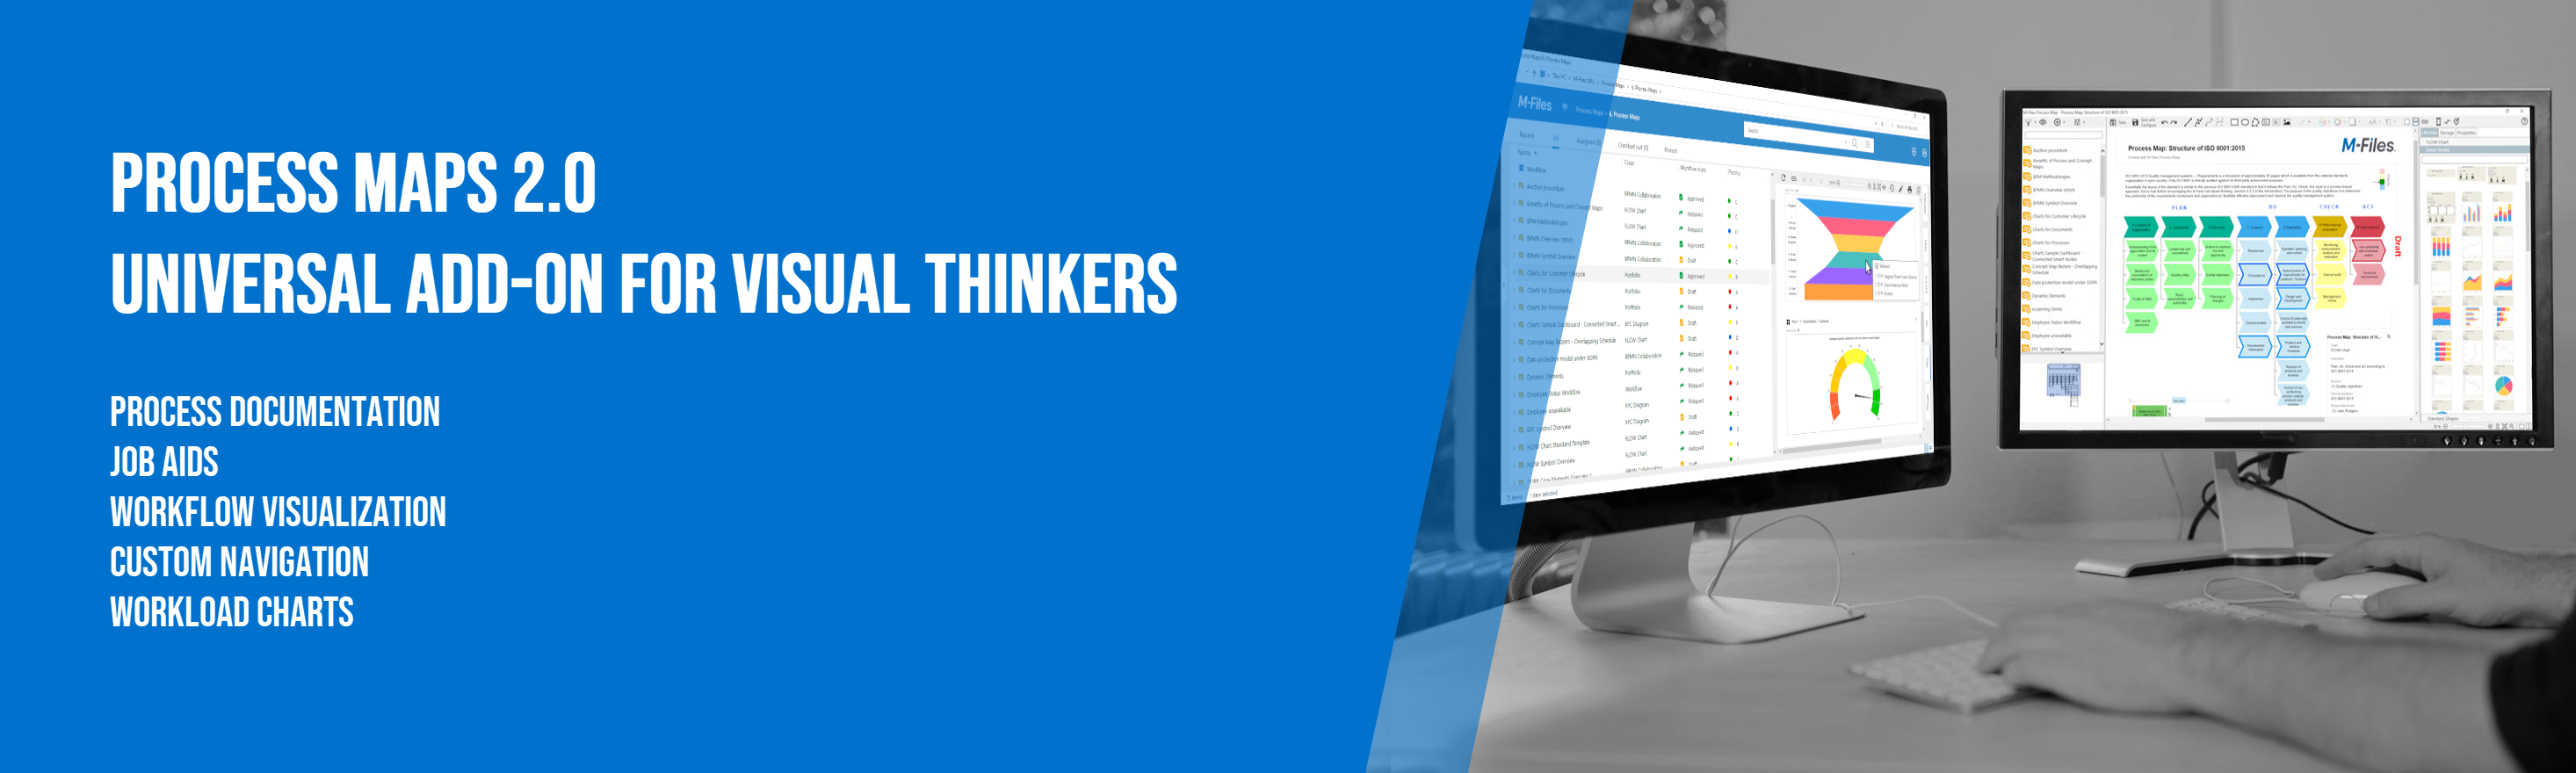
The add-on puts information in M‐Files in a visual context and guides users to relevant content. Graphical process maps combine and connect flowcharts with relevant documents, objects and views. They also provide action buttons to execute commands to interact with data or documents. Finally, Workload Charts can illustrate the content of views in a meaningful way, providing direct access to vault data.
M-Files users can visually navigate to the information stored in M-Files and they are guided to the right information in a way that is natural in the data context. M-Files Process Maps provides an editing environment to create graphical process descriptions as flowcharts, but also hierarchical menue structures, cheatsheets, workflow maps and job aids can be created.
M-Files Process Maps
This guide contains all articles for new M-Files Process Maps users. Learn more about the core concept:
This guide is intended for experienced M-Files users, administrators and consultants who want to set up and use M-Files Process Maps. Learn more about the daily use:
And of course we'll show you how to get the most out of this solution!
This guide aims to instruct on how to implement and use the M-Files add-on to create maps with advanced functionalities like commands, anchors and viewports. M-Files basic user and vault administrator knowledge is required. If you are unable to find the guidance or support you need in this guide, please see the M-Files user guide or contact M-Files support.
![]()