Table of Contents
Save and Configure
Within the Process Maps Designer you can choose between the options  Save and
  Save and Configure to save your process map. Select the Save and Configure entry to open a menu containing more options.
Please note that some tabs of the Save and Configure dialog can only be used by certain user groups. In the M-Files Admin configuration, you can set which user groups have access to which tabs. You can read the exact procedure here. The user groups mentioned here in this article reflect the default permissions construct.
The Save and Configure dialog provides you with a variety of options to customize the interaction capabilities of your process map. Let's first look at the tabs that can be accessed by all M-Files users.
Save
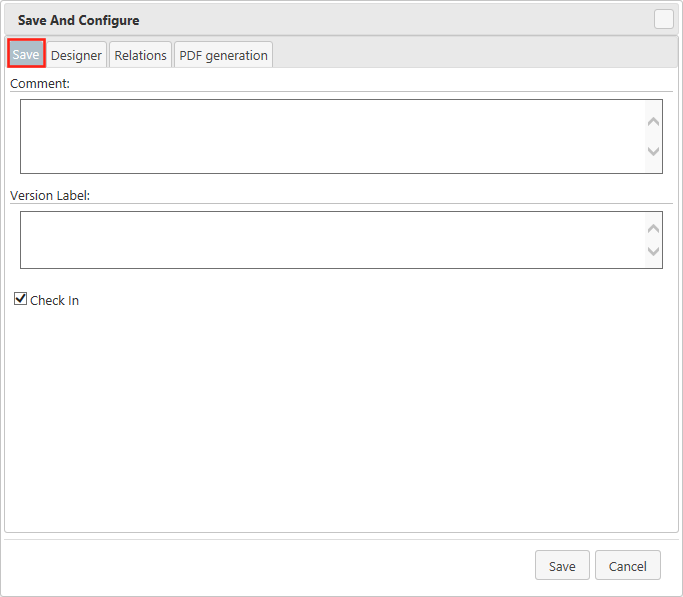
- Comment - Write a comment that will be attached to the process map. As any other M-Files Object, that comment will be displayed in the comment section directly in your M-Files client.
- Version Label - Add a version label to the current version of the process map.
- Check In - If you enable this option, the process map will be checked in as soon as you save it.
Designer
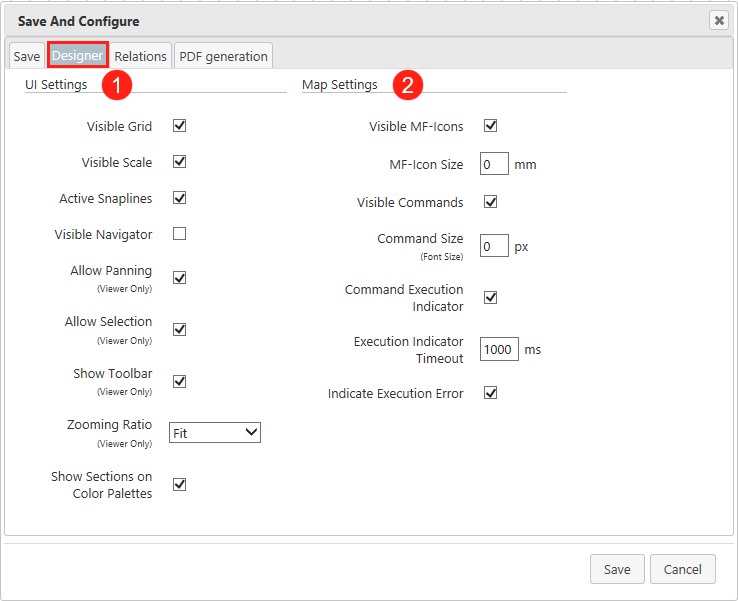
1. UI Settings
- the grid or snaplines (see Grid and Snaplines) are visible,
- the scale or navigator (see Process Maps Designer - User Interface Overview) are visible,
- Panning (in the Map Preview) is allowed (see Map Preview),
- Selection (in the Map Preview) is allowed (see Map Preview).
- Determine if the Toolbar is accessible within the preview (see Map Preview).
- Decide whether the default Zooming Ratio of the preview should be based on the entire content of the map (Fit), the Width or the Height of the map. In addition, this can also be set to 100% (see Map Preview).
- If you change these settings the map will in future be opened directly in the desired UI configuration within the designer.
2. Map Settings
- the M-Files Icons (see Hide MF-Icon are displayed or not and the M-Files icon size,
- the Commands (see Automatically Generated Commands) are displayed or not and the Command icon size,
- a Command Execution Indicator (animation for execution) is displayed or not and the Timeout after which the execution of the command action (see Create New Commands) will be stopped,
- a Error Message for stopped command executions is displayed or not.
Relations
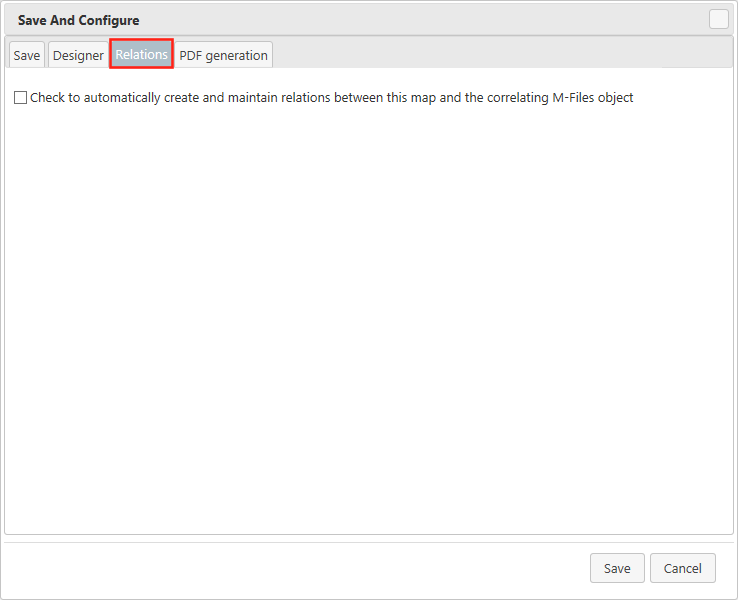
- Use the Relations tab to indicate if all relations from and to correlating M-Files objects in your map are created and permanently maintained when saving. Depending on the number of objects used, this may of course be at the expense of performance. On the other hand, this is a very useful feature, e.g. if you want to see which documents were referenced on which maps or which departments were mentioned.
PDF generation
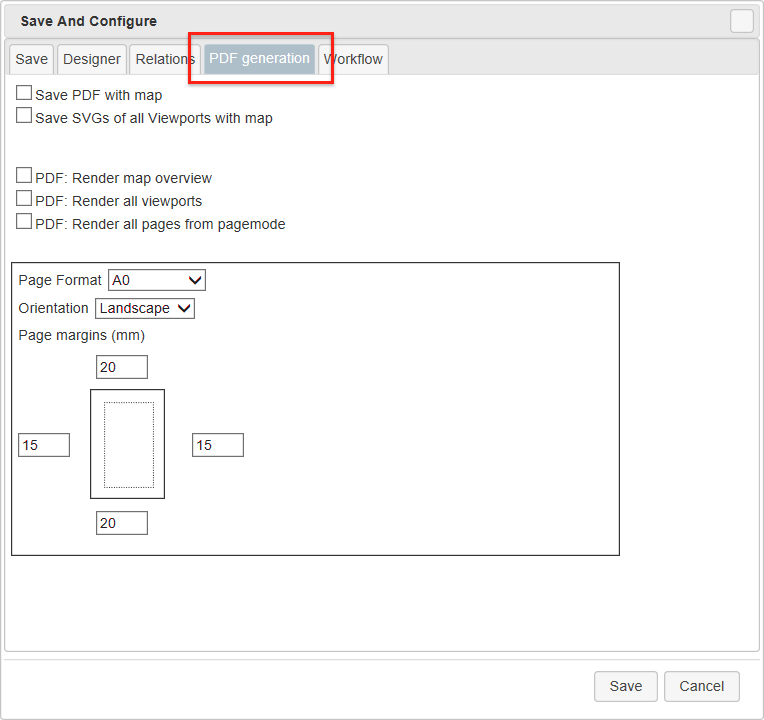
With the help of the tab PDF generation, different representations of the map can be automatically generated when the map is saved:
- The Save PDF with map option allows the SVG of the map to be rendered into a PDF file, which is stored in the Process Map object. The components of the PDF file can be further specified (by activating the following options):
- PDF: Render map overview creates an image of the entire map according to the format settings that can be made in the lower section.
- PDF: Render all viewports creates an image of the viewports (see Create Anchors and Viewports) in the PDF.
- PDF: Render all pages from pagemode creates an image of the Process Maps Designer pagemode (see Process Maps Designer - User Interface Overview) in the PDF.
- The Save SVGs of all Viewports with map option stores the automatically created image files of all viewports in the Process Map Object when rendering the PDF.
- In the lower area typical formatting settings of the PDF can be adjusted:
- Page Format
- Orientation
- Page margins
Show With View
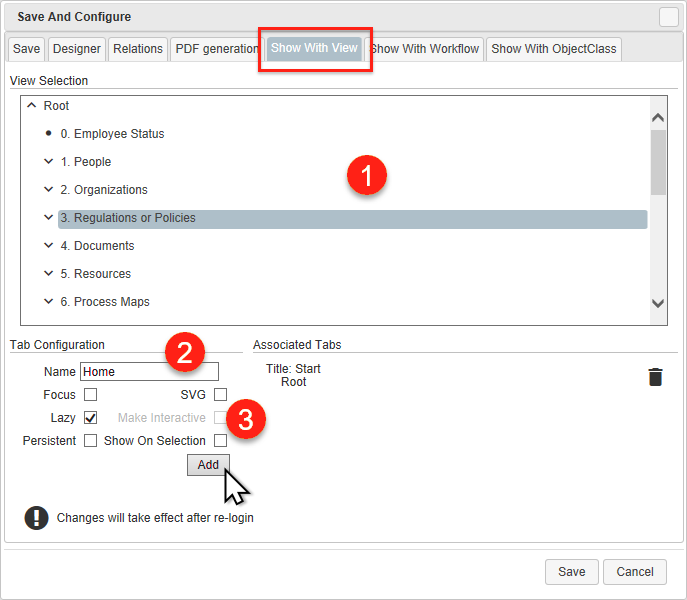
- The Show With View tab (for user with rights
Full control of vaultorManage common views and notification rules) allows to see the map in the Process Map Preview tab if certain views are opened or selected in the M-Files Client. You can select a view (1), specify the name (2) of the tab in M-Files and define some display options (3):- Focus: the map is directly displayed when the view is opened.
- SVG: the system shows the image file only as a preview (faster loading).
- Lazy: not all data objects are loaded immediately, but only when needed (faster loading, but reloading is required).
- Make Interactive (in combination with SVG): A 'Make Interactive' button can be enabled to activate the fully functional map viewer only when needed (see Speed optimization).
- Persistent: Enable this item to display the map beyond its actual tab. If you activate this for a map assigned to the root view, it will be displayed as a static tab in every view of your M-Files Vault. For example, you can establish a central navigation menu or a process house that is always accessible by the user. If you assign the map to a specific view, this option will cause it to be displayed in all sub-views/virtual folders below it.
- Show on selection: Activate this option to display the map when a view in the client is simply selected and not yet open.
Show With Workflow
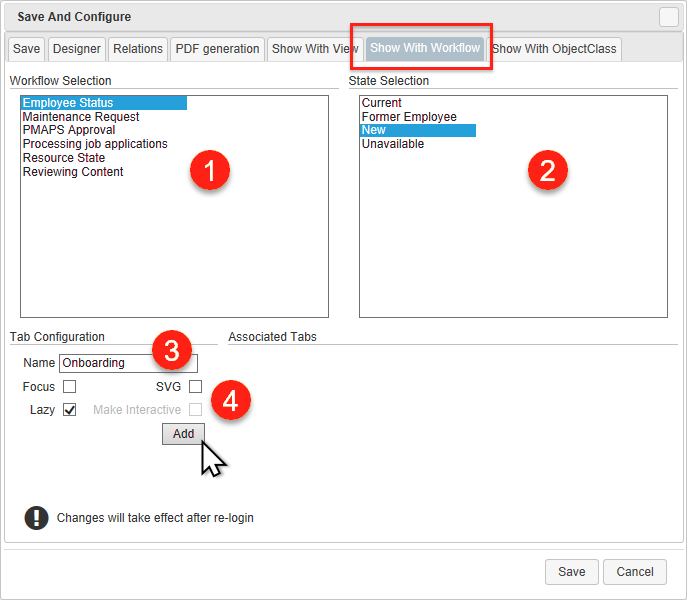
- The Show With Workflow (for user with rights
Full control of vaultor theManage workflows) tab allows you to view the map in the Process Map Preview tab when objects are selected that correspond to the selected workflow and status. Think of this as work step related guides. (Note: Do not confuse this functionality with workflow maps. These are opened directly with the corresponding workflow and do not need to be assigned.)
You can select a workflow (1), specify the status (2) in which the tab is to be displayed in M-Files, assign a name (3) to the tab, and define some display options (4):- Focus: the map is directly displayed when an object is marked with the suitable workflow and state.
- SVG: the system shows the image file only as a preview (faster loading).
- Lazy: not all data objects are loaded immediately, but only when needed (faster loading, but reloading is required).
- Make Interactive (in combination with SVG): A 'Make Interactive' button can be enabled to activate the fully functional map viewer only when needed (see Speed optimization).
Show With ObjectClass
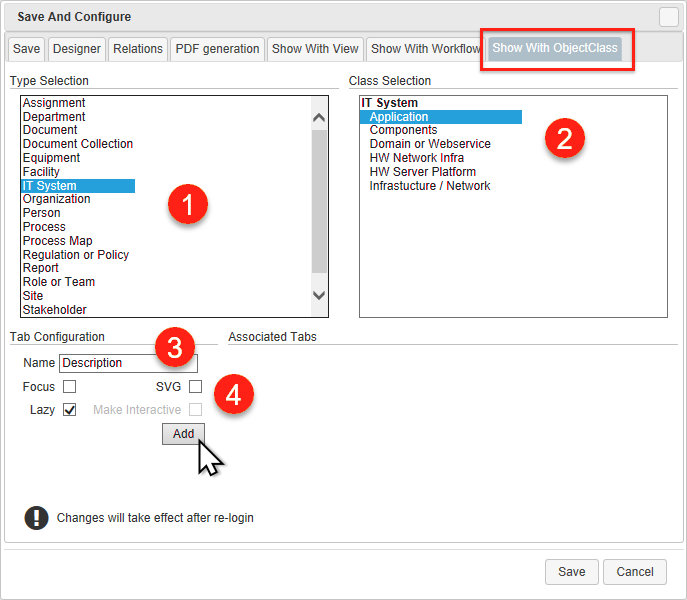
If you have appropriate (M-Files admin) rights for the vault, you can use additional configuration entries to manage the M-Files user interface:
- The Show With View tab (for user with rights
Full control of vaultorManage common views and notification rules) allows to see the map in the Process Map Preview tab if certain views are opened or selected in the M-Files Client. You can select a view (1), specify the name (2) of the tab in M-Files and define some display options (3):- Focus: the map is directly displayed when the view is opened.
- SVG: the system shows the image file only as a preview (faster loading).
- Lazy: not all data objects are loaded immediately, but only when needed (faster loading, but reloading is required).
- Make Interactive (in combination with SVG): A 'Make Interactive' button can be enabled to activate the fully functional map viewer only when needed (see Speed optimization).
- Persistent: Enable this item to display the map beyond its actual tab. If you activate this for a map assigned to the root view, it will be displayed as a static tab in every view of your M-Files Vault. For example, you can establish a central navigation menu or a process house that is always accessible by the user. If you assign the map to a specific view, this option will cause it to be displayed in all sub-views/virtual folders below it.
- Show on selection: Activate this option to display the map when a view in the client is simply selected and not yet open.
Workflow
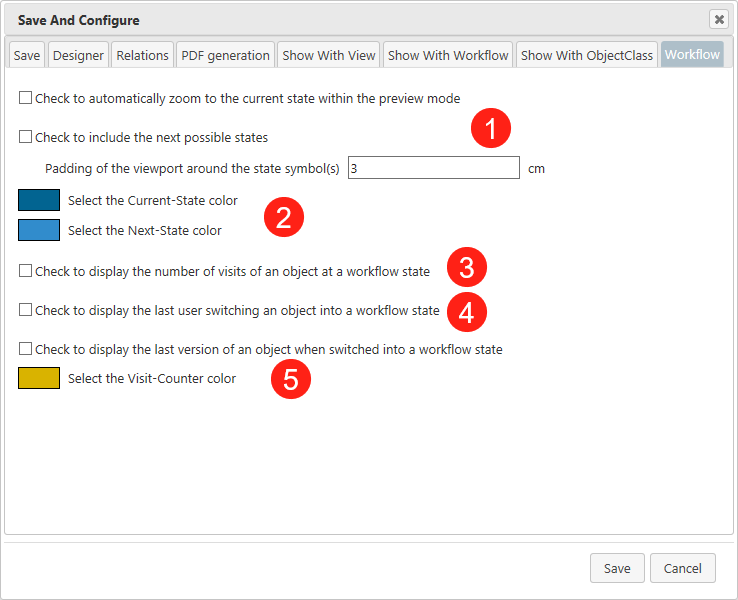
When you use Save and Configure in a Workflow Map, also the Workflow tab appears. Here you can:
- specify whether the map automatically zooms to the current workflow status and whether the next possible states should be included. Here you can also define the size of the zoom area.
- select the colors for marking the current status and the next status states.
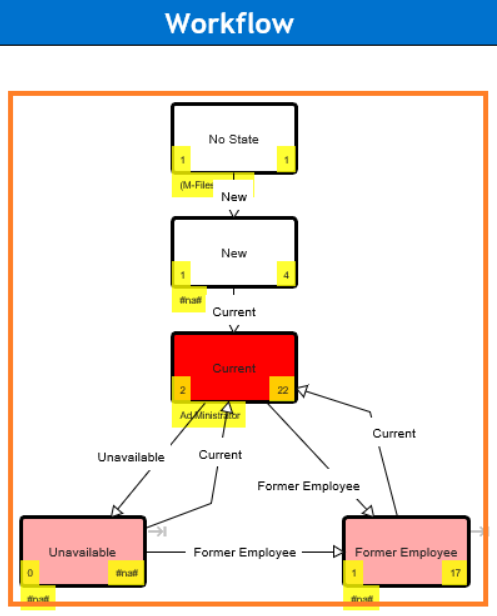
- show the number of visits - taken from the version history - of each status state,
- show the the last user - taken from the version history - of each status state,
