

meta data for this page
Work with Workflow State Viewports

Workflow state viewports work similarly as the green workflow state symbol. The only difference is, that a zone of the map is highlighted. You can use this zone for any content you like.
Workflow State Viewports - then shown in the preview:
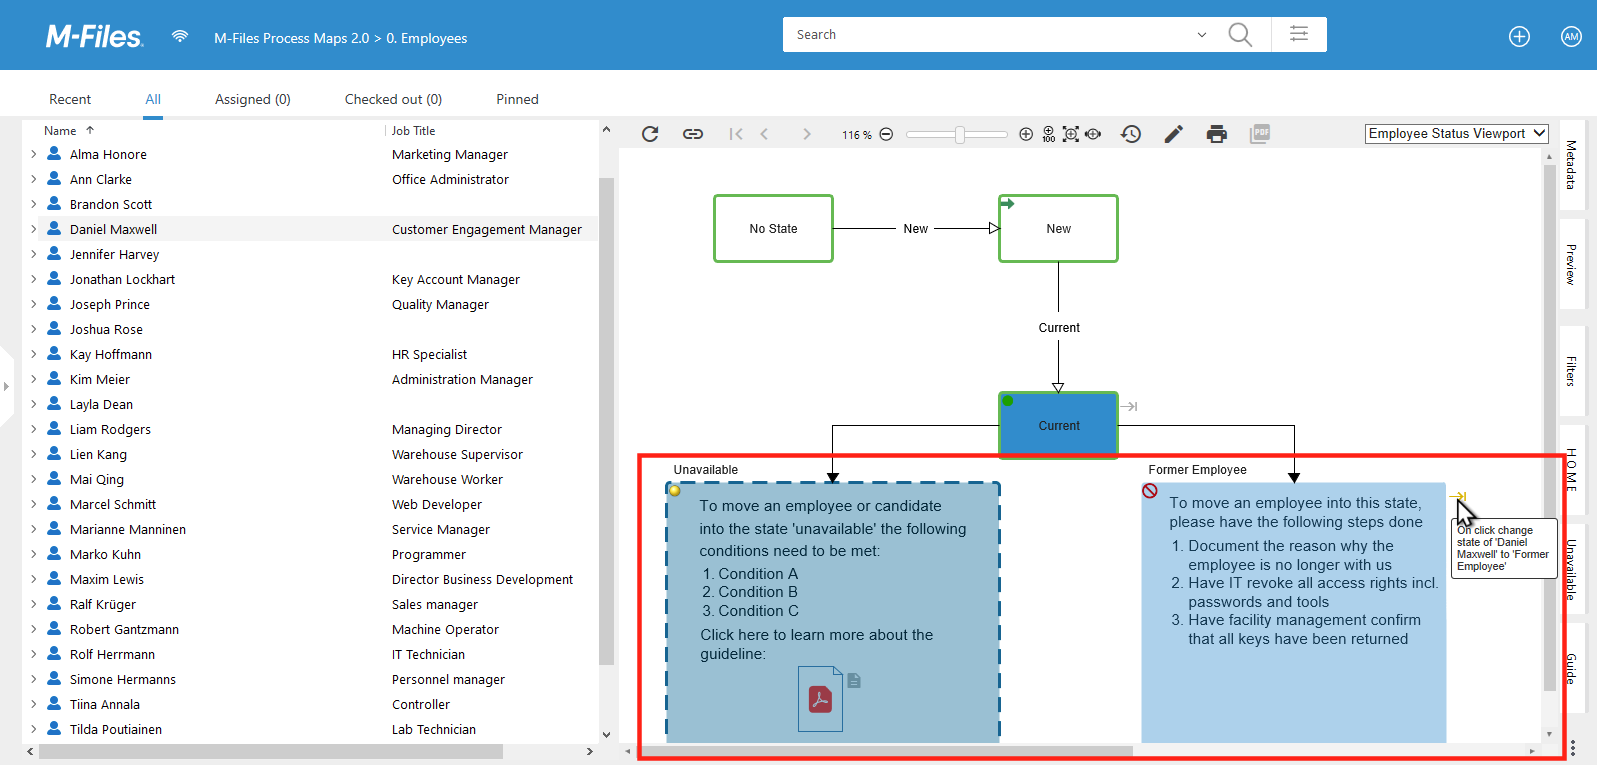
Note that the viewports receive a dynamic color and also show the “on click change state” command icon in the upper right.
If you combine this functionality with the “check to automatically zoom to the current state”, you can do very useful things. See an example here:
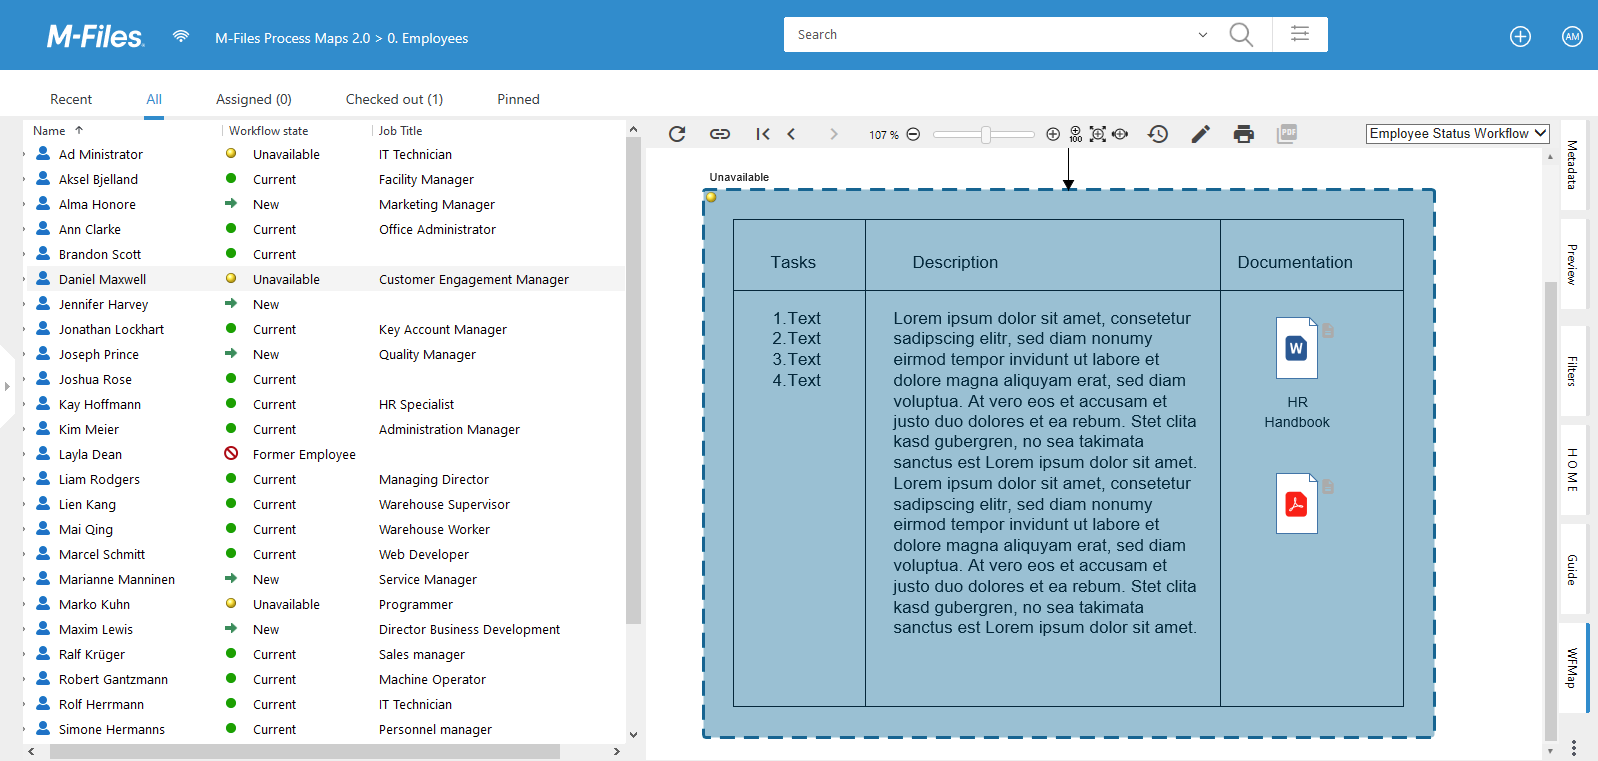
You could create a map with rules and guidelines for each step.
Sometimes it can be useful to use existing modeling from other applications to work in a productive manner at higher pace.
For example, graphic files from M-Files Admin, Microsoft Visio, Dia, yEd Graph Editor, OpenOffice Draw, Draw.io, LucidChart, or other modeling tools can be easily integrated by exporting image files (PNG, SVG) to M-Files, embedding them in your process maps using the 'Insert Images via M-Files Objects' function (see Insert Images via M-Files Objects), and providing them with Workflow States viewports:
- Drag & Drop Workflow State Viewports directly onto Images
Ctrl+ Drop inserts the viewports with transitionsShift+ Drop inserts the viewports without labels